Case Study: Blankslaps
Blankslaps is a founder-led B2C/B2B business I launched in 2018 and have operated end-to-end for seven years.
I treated design as one lever inside a broader system. Design is responsible not just for UI, but for profitability, lifetime value, operational throughput, and founder time leverage under real constraints.
Highlights
21,000+ orders via 400k sessions
$700k gross sales, driven organically
AOV increased 5× through incentive design
43% repeat customer rate, with long-tail customers placing 30+ orders
Zero paid acquisition; Instagram as primary growth channel
Role
I am the Founder, Product Owner, and Lead Designer. I own strategy, product design, pricing architecture, growth systems, fulfillment, and operations. Every decision directly affects margins, inventory risk, and time.
The Problem
Operational Drag of Order Fulfillment
Like many early stage founders, initially I considered my time as a free currency. Because of this, I fulfilled orders myself. This led to a leverage killing cycle:
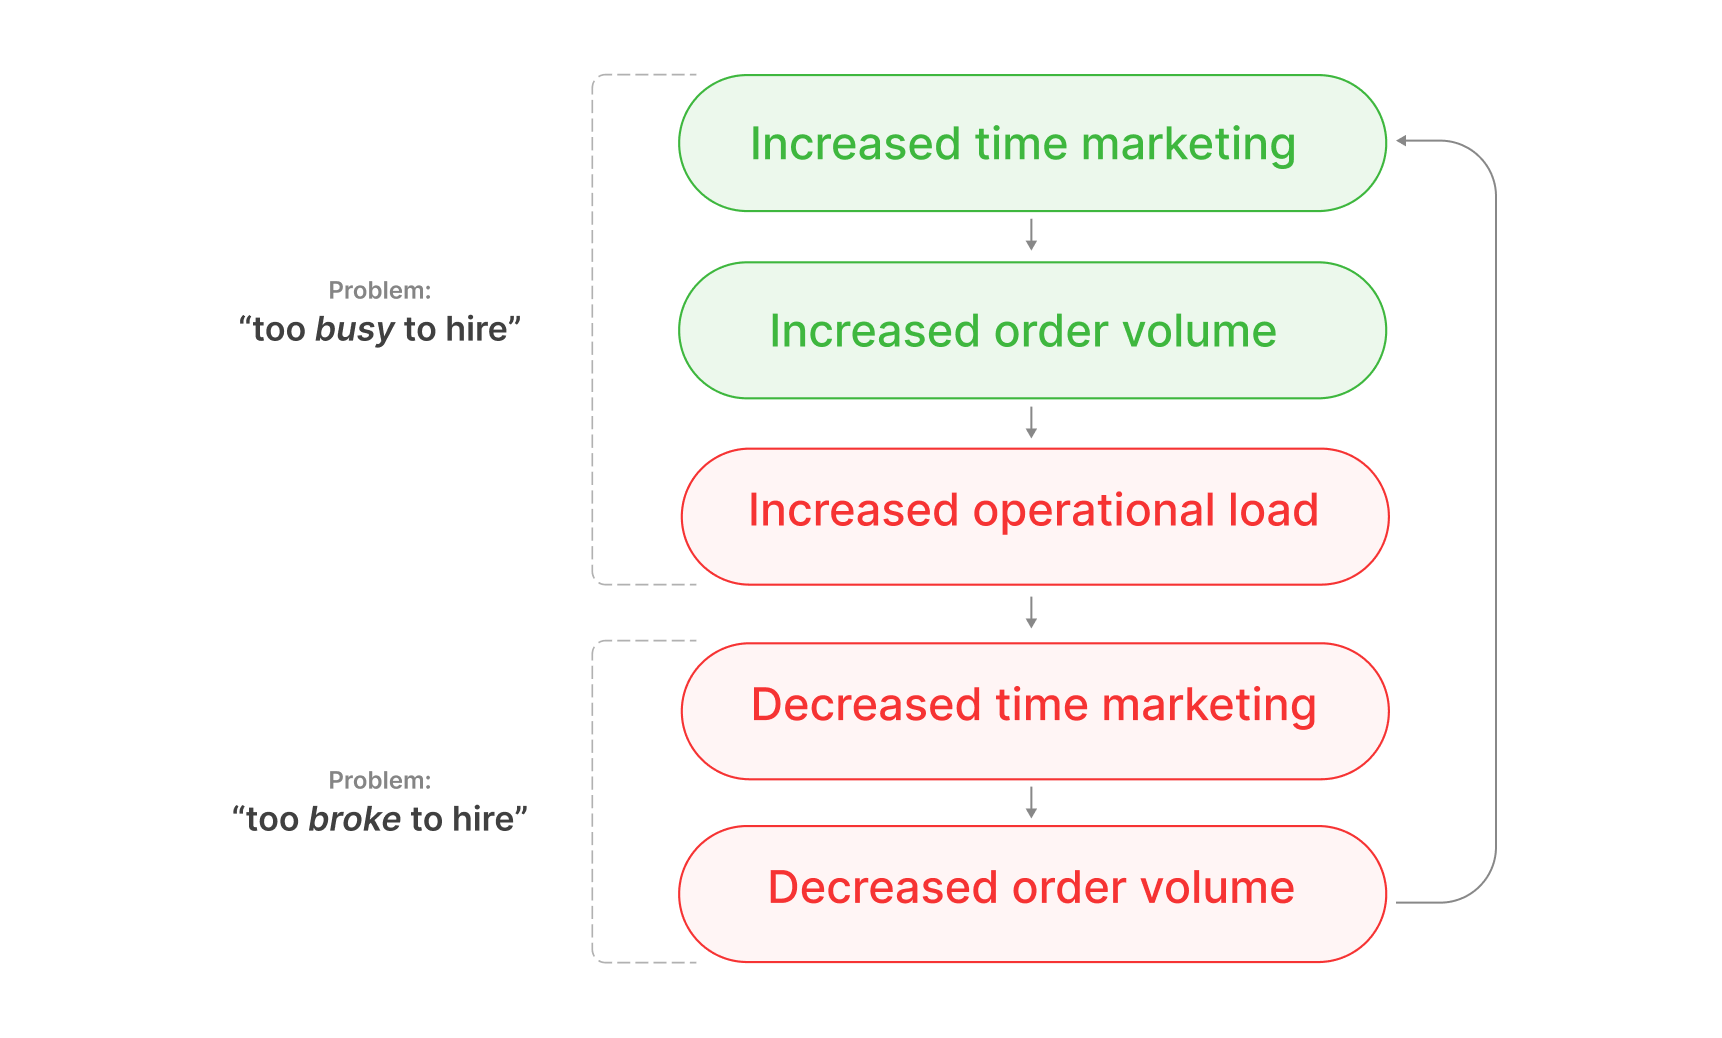
When orders were low, I'd have tons of time to drive traffic, causing the operational load of order fulfillment to increase. Subsequently, I would have less time for marketing, and orders would go down again.
Sketchy Unit Economics
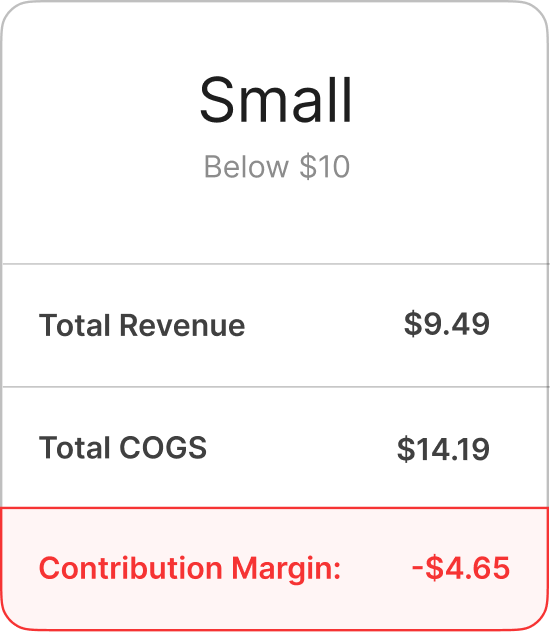
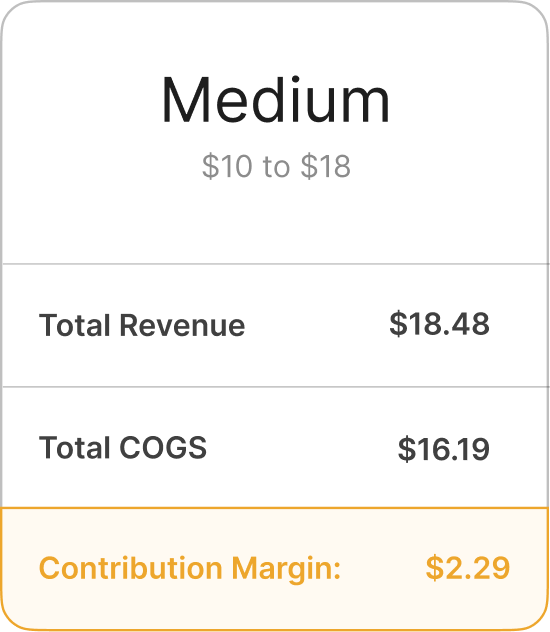
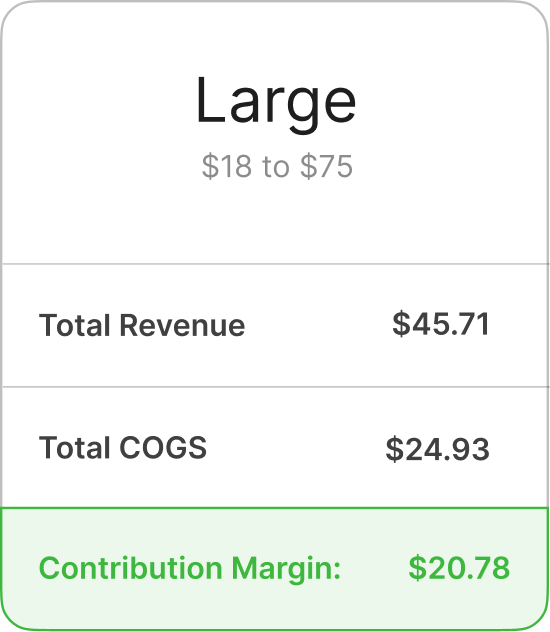
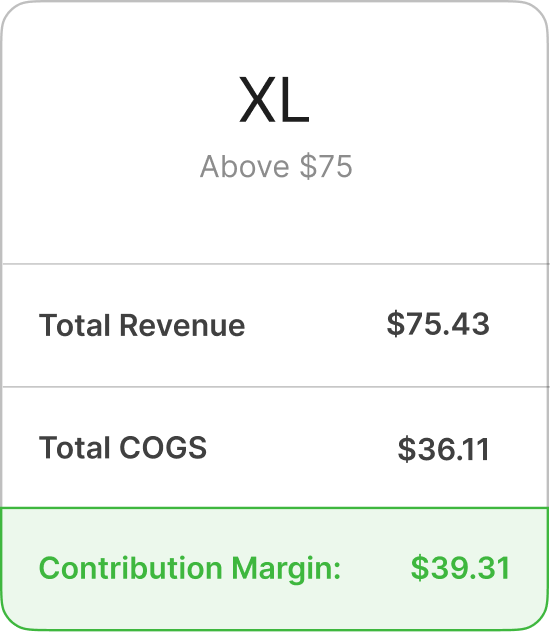
As operating costs increased, our unit economics shifted. Factoring in rent and labor into COGS revealed that orders below $18 were hardly profitable.
Contribution Margin by Segment 2024
Order Volume by Segment
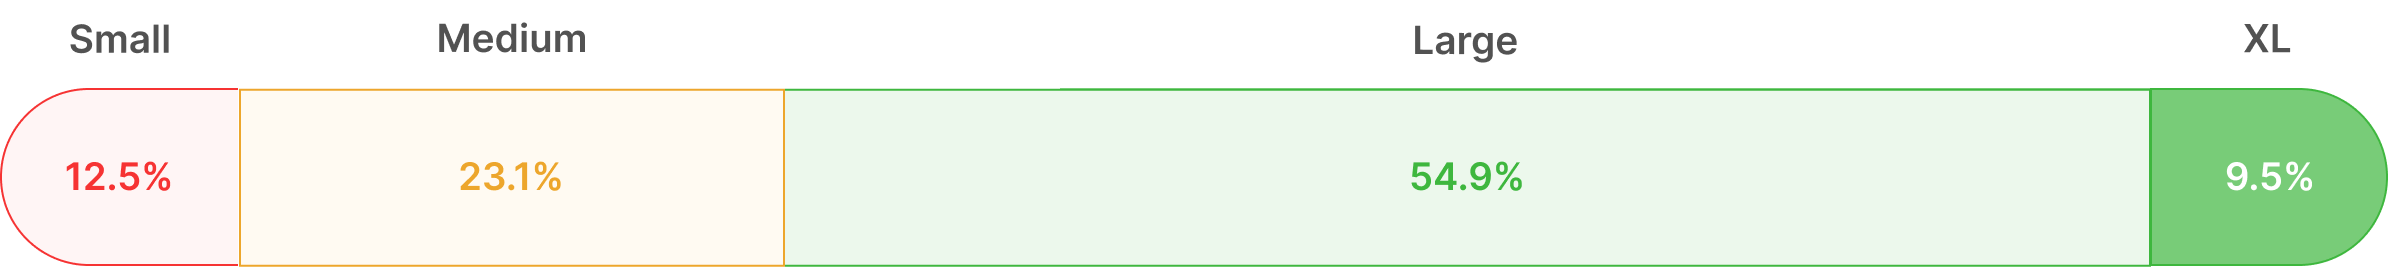
The takeaway was clear: avoid small orders, fix medium orders, and aggressively push large and XL orders. Large orders were worth ~10× more than medium ones, yet ~35% of volume came from small and medium orders.
Limited spend categories
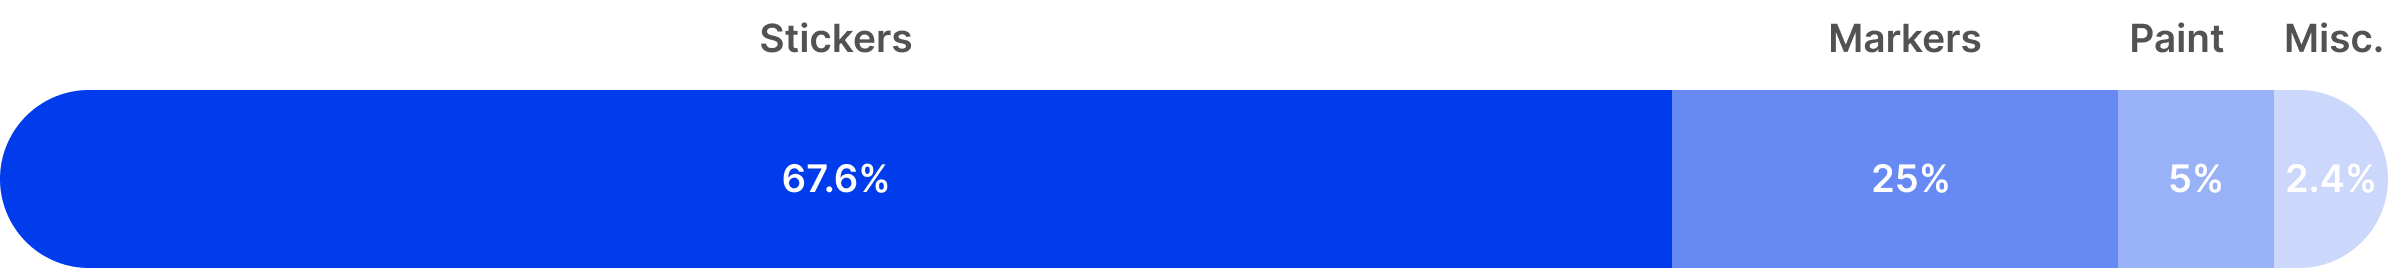
Customer spend was mostly concentrated in two narrow categories, capping growth. We hypothesized that expanding into higher-share art supply categories like aerosol and fine art supplies would increase wallet share and overall sales.
Revenue per Category
Limited Acquisition Channels
The funnel itself converted well, but growth was constrained by acquisition. Traffic came almost entirely from organic channels. The products, which are low-margin, practical supplies with little visual appeal, were difficult to market through traditional ads. Without a large owned audience, the constraint was getting more qualified traffic, not fixing checkout.
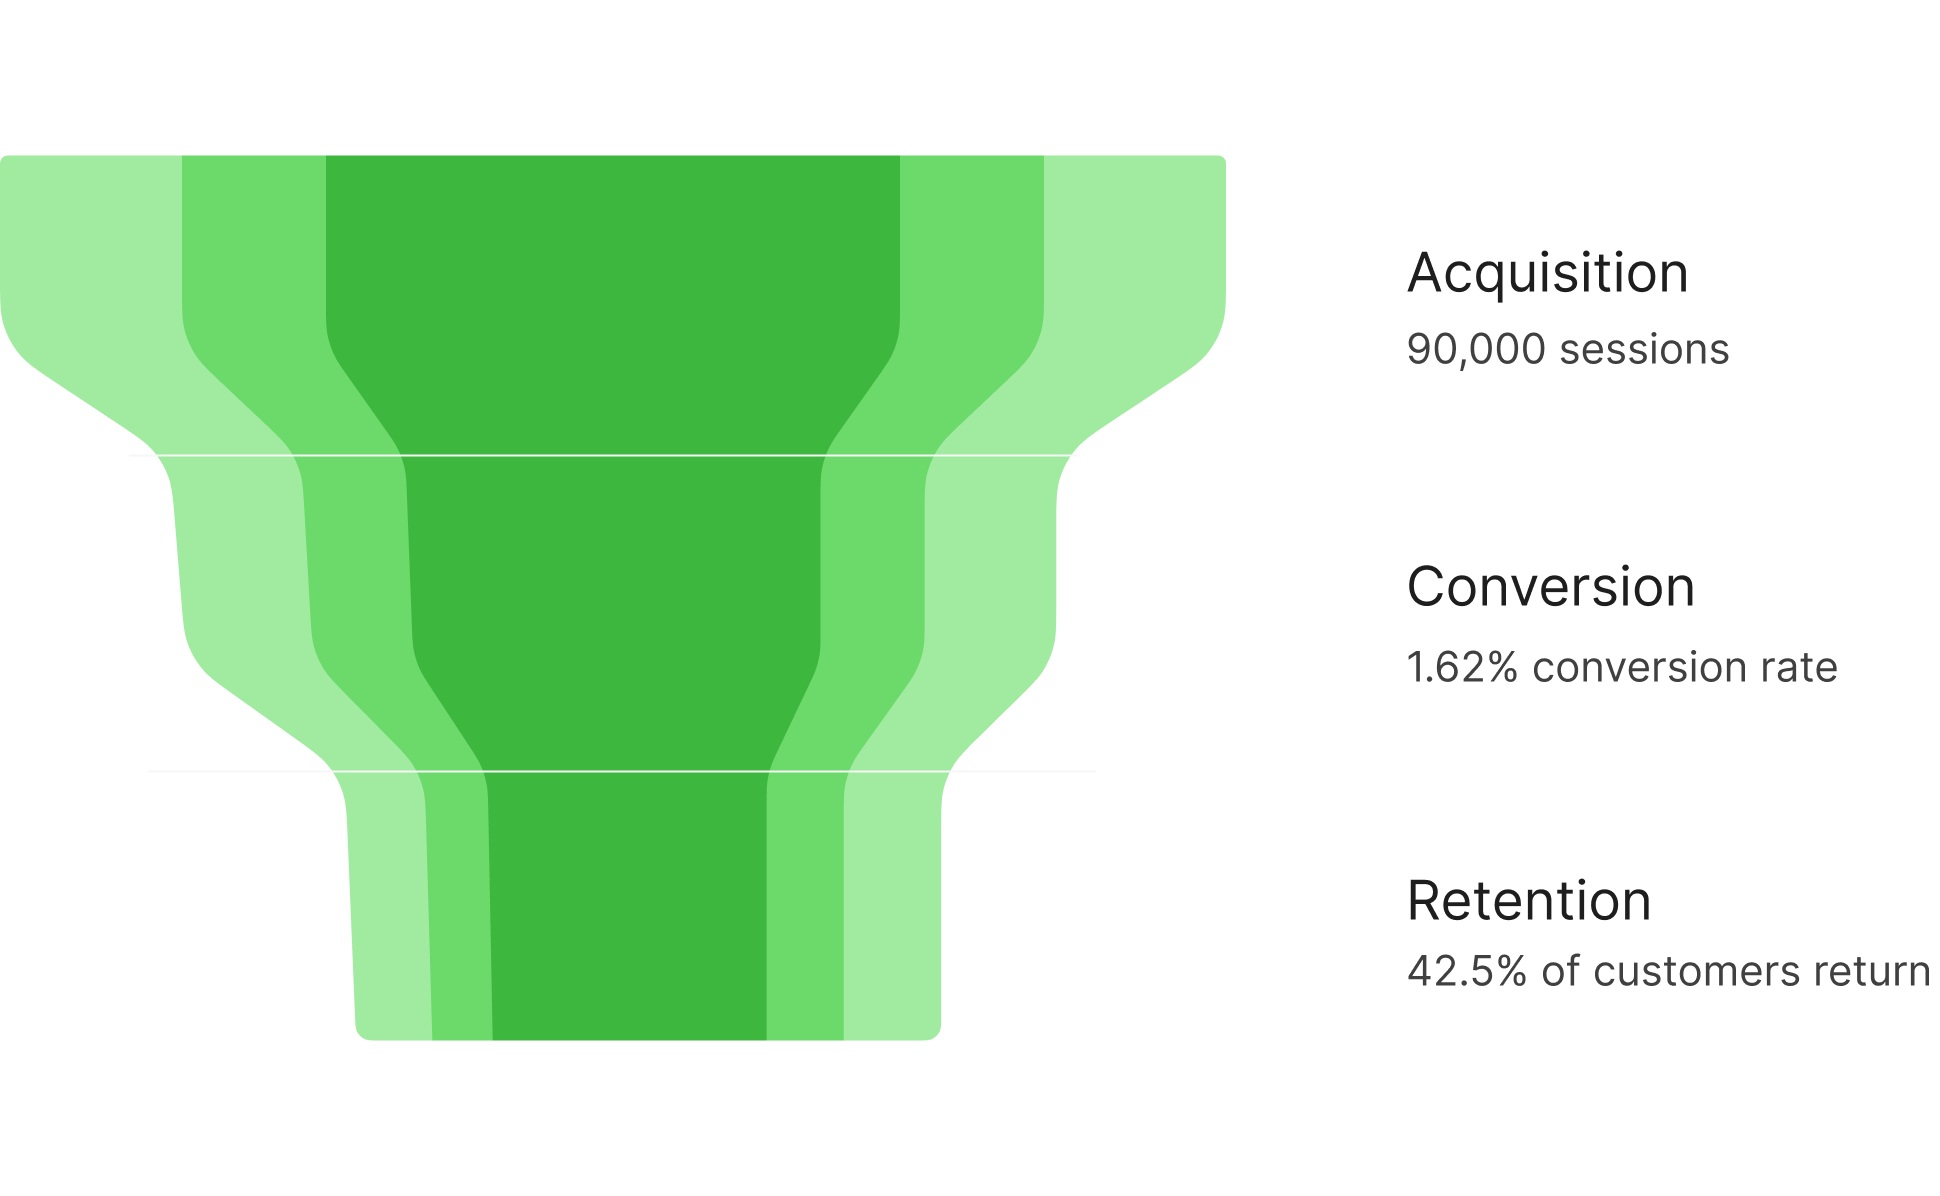
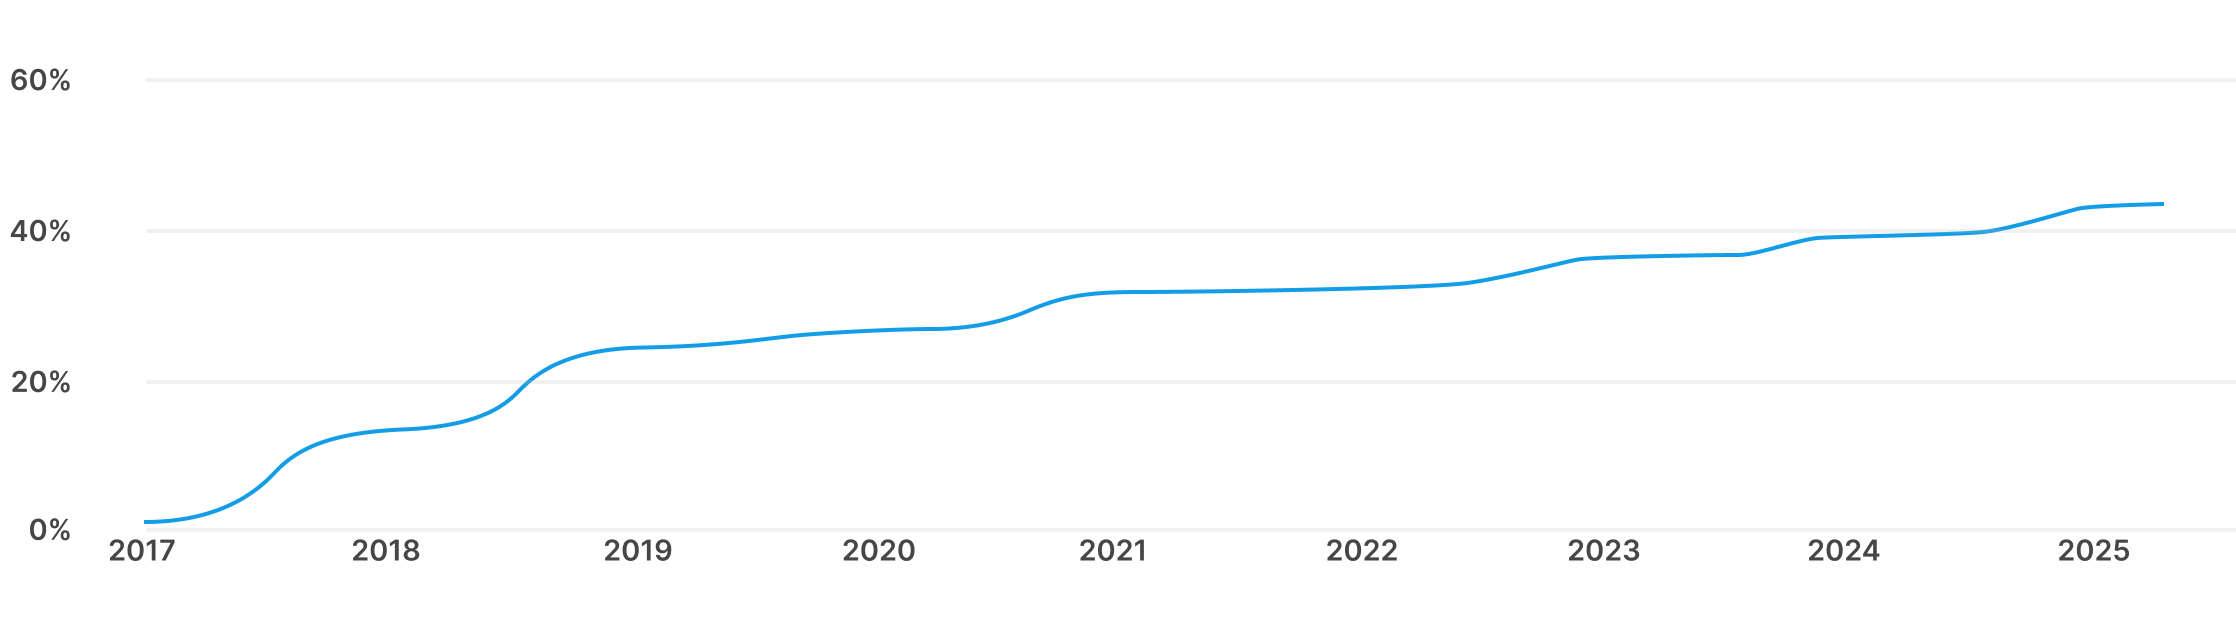
Retention
Long-tail retention was healthy, although we wanted to improve short term retention specifically within the first few months after a customers first order.
Returning Customer Rate
Conclusion
Taken together, these constraints made the challenge clear: design a system that maximized reach without paid media, increased profit through deliberate AOV and pricing architecture, reclaimed founder time through better fulfillment decisions, and reduced reliance on constant acquisition by strengthening retention.
Solving Fulfillment
Problem
Fulfillment had become a bottleneck: packing orders, customer support, and warehouse management consumed up to four hours a day and limited higher-leverage work. We treated fulfillment as a product decision, aiming to reclaim founder time while protecting margin.
Third-party logistics was evaluated early but ruled out. Orders often included up to 20 low-cost SKUs, which would have triggered multiple pick fees, while long-tail inventory made storage costs scale poorly. At our size, 3PL was not economically viable.
Solution
We first ran our own warehouse to absorb picking complexity and support SKU expansion. While this preserved margin initially, the larger space and broader catalog failed to increase profit. Higher rent degraded profit per order, and the added complexity outweighed the benefits.
We ultimately simplified: underperforming SKUs were liquidated, and the operation was rebuilt around fast-moving products in a smaller space. This reduced rent by 65%, improved net revenue, and restored operational focus.
Improving Unit Economics
Overview
Order value was the single biggest driver of profitability. Orders under $14 lost money. ~$18 orders were barely efficient. Median orders generated ~10× more value than small orders, making AOV the critical lever.
Solution
We increased AOV by selectively raising prices, reducing COGS per order, improving bundle efficiency, expanding bundle options, and introducing shipping minimums to steer customers toward higher-value orders.
Median Contribution Margin Improvements
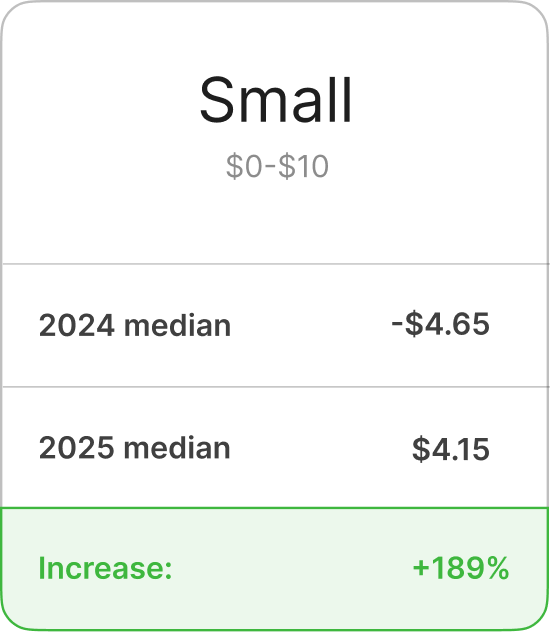
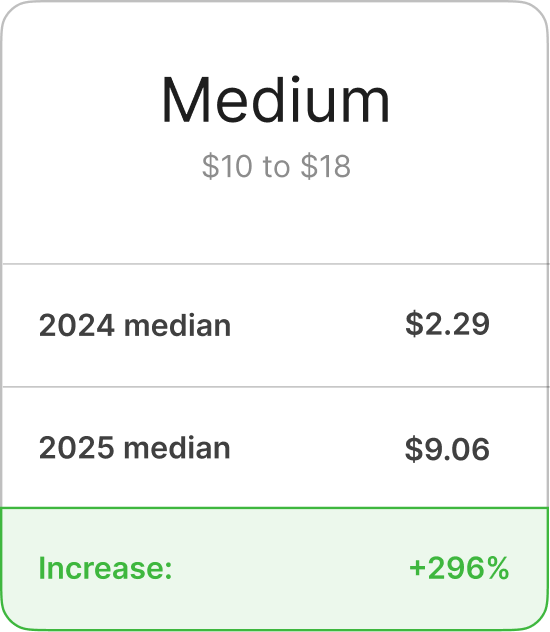
Improvements to value segments
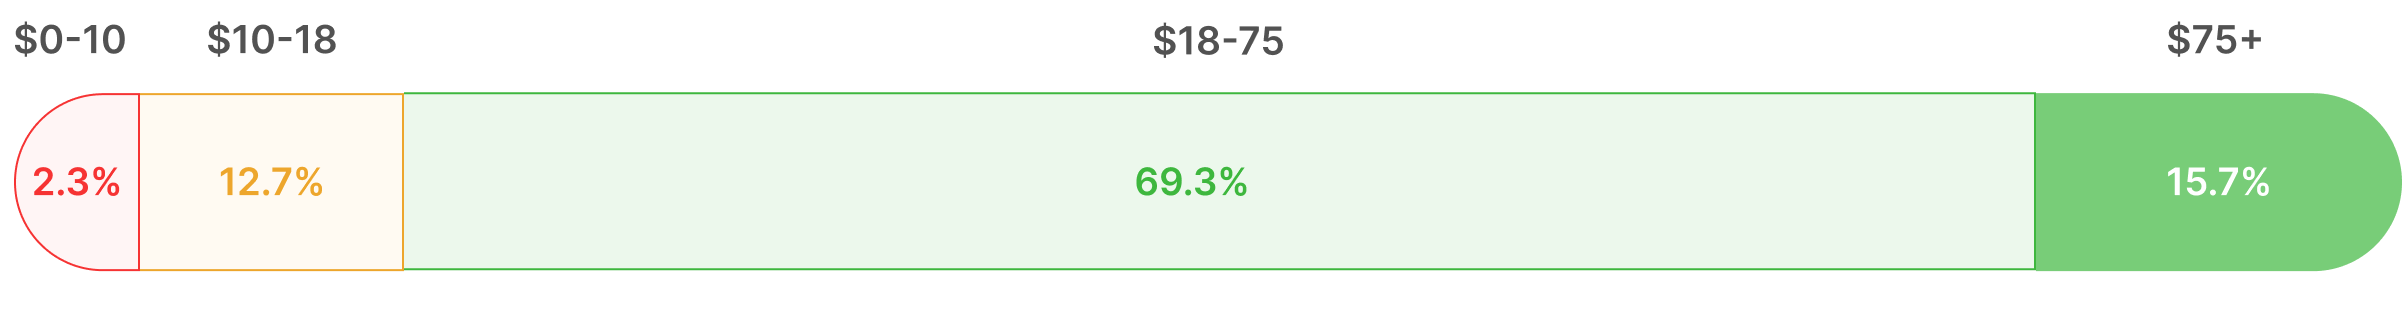
Just as importantly, the order mix moved up-market. Small and medium orders fell from 35.6% to 15.0% of total volume, while large and XL orders increased from 64.4% to 85.0%. This concentrated demand in the highest-margin segments, materially increasing profit per order without relying on additional volume, increasing AOV by 41% in 2025 compared to 2024.
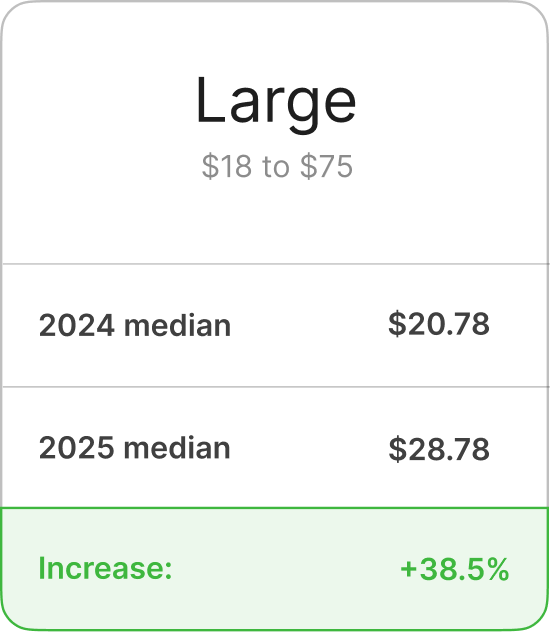
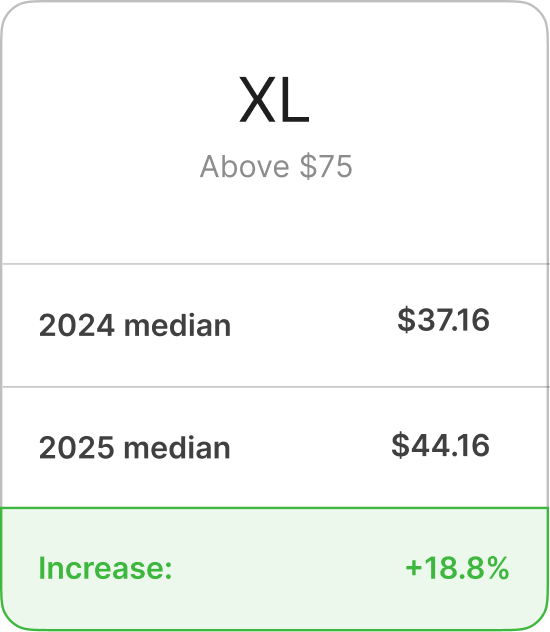
Value Segments (2024)

Value Segments (2025)
Improvements to AOV
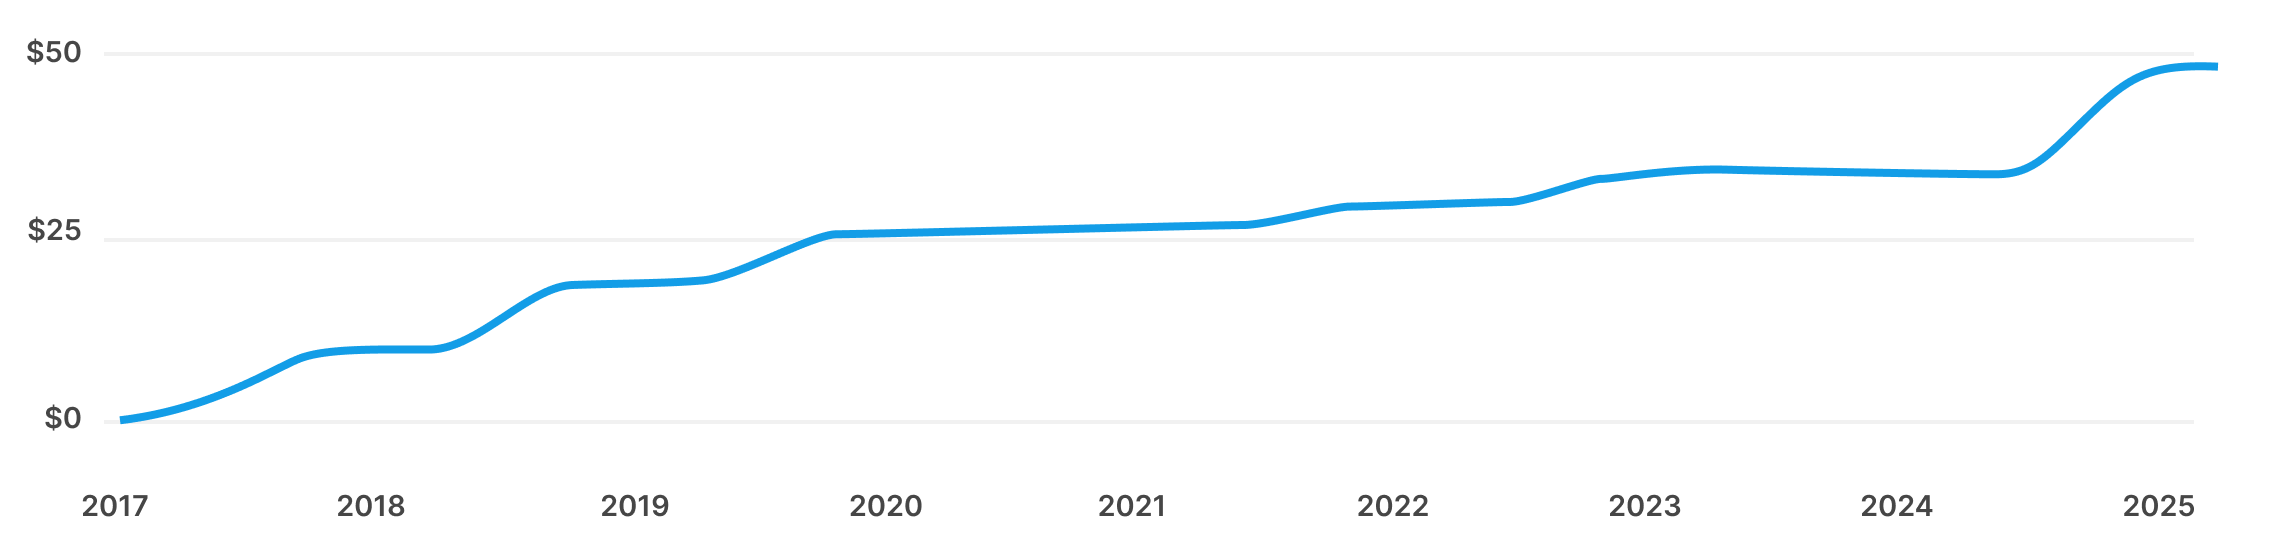
AOV increased for the seventh consecutive year, with a major jump in 2025. Average order value rose 41% YoY, climbing from roughly $35 to $49.
This was driven by aggressive bundling and incentive structures that shifted demand toward larger orders, reinforcing the broader move up-market and materially improving profit per order.
Average Order Value
Shipping threshold experiments
We tested multiple free-shipping strategies to reduce checkout friction and increase volume. While the hypothesis was that lower or universal free shipping could materially lift conversion, the results did not support it.
Free shipping on all orders required a 2–3× conversion increase to offset margin loss; conversion and cart abandonment changed only marginally, making the approach unsustainable. Lower thresholds ($30–$100) similarly failed to deliver meaningful volume gains and instead cannibalized AOV, removing incentive for the $75+ orders required by our unit economics.
The winning solution was free shipping over $75, which aligned with our cost structure, preserved AOV, and matched category norms. It reduced friction without sacrificing profitability and became the default.
Retention
Including sample packs in every order materially increased repeat purchases within 30/60/90 days, contributing to a 10% YoY increase in returning order rate. Email and lead magnets reinforced re-engagement, and at peak ~45% of customers were repeat buyers, with some placing 30+ lifetime orders.
Downstream effects
Conversion declined 34% YoY following price increases and higher shipping thresholds, but profit per order rose enough to more than offset the loss. This reset the business on sustainable unit economics and created a foundation to pursue future conversion gains from a position of profitability rather than volume.
Expanding acquisition
Organic Acquisition
Thin profit per order limited paid acquisition, making organic the primary growth channel. In organic, the constraint was visual: without a sale or hook, utilitarian supplies didn't earn attention.
Top-of-funnel growth came from reposting viral content within our niche, building an audience of 60k highly relevant followers. Memes became the core marketing engine, announcing sales, drops, and restocks while outperforming traditional marketing by 10–100× in engagement.
Additional Channels
To reduce dependence on organic growth, we added two lightweight acquisition channels that required no paid media.
Affiliate acquisition was effective, but highly asymmetric. Two creators drove ~97% of influencer revenue. One generating $47k, the other $8k. The remaining ~50 additional affiliates produced negligible impact. The takeaway was clear: focus on top performers, not broad participation.
Cold outreach was less powerful, but generated thousands of low-friction, one-to-one conversations that felt personal rather than promotional, creating incremental demand outside traditional marketing. Organic remained the primary channel, but these additions provided meaningful diversification.
Capturing spend
Increased selection
We aggressively expanded SKU count to test category breadth across street art supplies, blank stickers, fine art supplies, merch and collectibles, and spray paint.
Spend per Category (2024)

Spend per Category (2025)
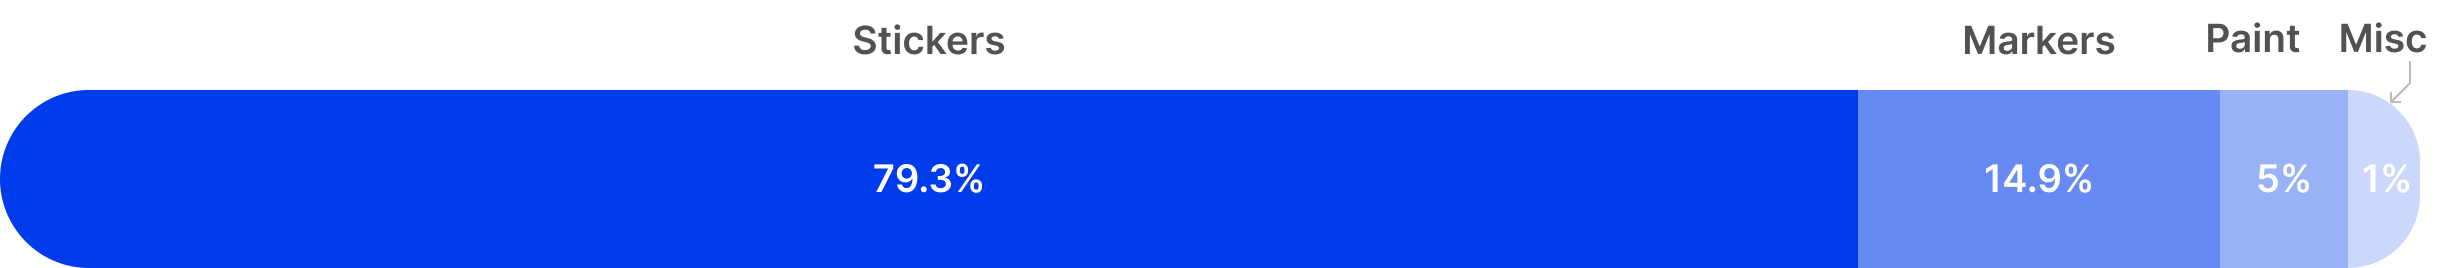
Results
Expanding sticker selection successfully increased sticker wallet share. Spray paint saw only marginal gains and failed to justify its operational cost. Paint accounted for ~7% of revenue while consuming ~50% of warehouse space. We exited the category to reduce rent and protect margin.
Reflection
Blankslaps fundamentally changed how I evaluate design. I've spent weeks designing and developing pixel perfect e-commerce websites: the lift was zero. Then I spent 2 days re-designing our order incentive system, and doubled the profitability of each order.
I no longer optimize for elegance or conversion in isolation. I optimize for leverage inside real systems.
I love beautiful pixel perfect websites, but there is a time and place for everything.
Other Projects